Strategies & Systems
This page is dedicated to publishing different strategies and systems that may be used in Forex trading. Implementing some of these strategies / systems may improve your success as a Forex trader, but is not investment advice and only for teaching purposes.
PLEASE NOTE:These strategies are just examples of different trading approaches. The strategies and systems that are taught in our courses are totally different, guaranteed and profitable systems that we teach in detail and trade ourselves on our own live accounts.
Strategy - A:
Bump and Run Reversal Strategy:
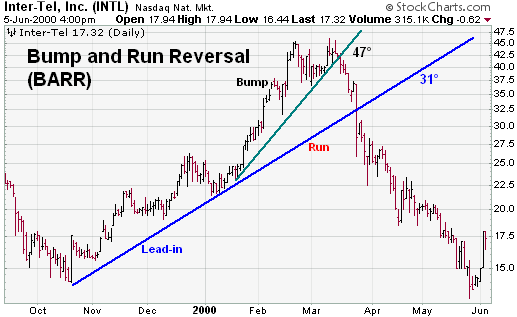
As the name implies, the Bump and Run Reversal (BARR) is a reversal pattern that forms after excessive speculation drives prices up too far, too fast. Developed by Thomas Bulkowski, the pattern was introduced in the June-97 issue of Technical Analysis of Stocks and Commodities and also included in his recently published book, the Encyclopedia of Chart Patterns.
The pattern was originally named the Bump and Run Formation, or BARF. Bulkowski decided that Wall Street was not ready for such an acronym and changed the name to Bump and Run Reversal. Bulkowski identified three main phases to the pattern: lead-in, bump and run. We will examine these phases and also look at volume and pattern validation.

-
Lead-in Phase: The first part of the pattern is a lead-in phase that can last 1 month or longer and forms the basis from which to draw the trend line. During this phase, prices advance in an orderly manner and there is no excess speculation. The trend line should be moderately steep. If it is too steep, then the ensuing bump is unlikely to be significant enough. If the trend line is not steep enough, then the subsequent trend line break will occur too late. Bulkowski advises that an angle of 30 to 45 degrees is preferable. The size of the angle will depend on the scaling semi-log or arithmetic) and the size of the chart. It is probably easier to judge the soundness of the trend line with a visual assessment.
-
Bump Phase: The bump forms with a sharp advance, and prices move further away from the lead-in trend line. Ideally, the angle of the trend line from the bump's advance should be about 50% greater than the angle of the trend line extending up from the lead-in phase. Roughly speaking, this would call for an angle between 45 and 60 degrees. If it is not possible to measure the angles, then a visual assessment will suffice.
-
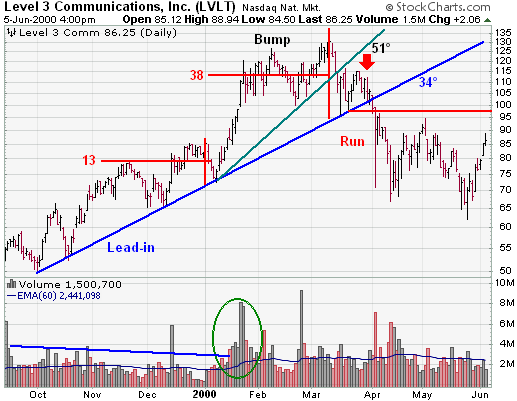
Bump Validity: It is important that the bump represent a speculative advance that cannot be sustained for a long time. Bulkowski developed what he calls an "arbitrary" measuring technique to validate the level of speculation in the bump. The distance from the highest high of the bump to the lead-in trend line should be at least twice the distance from the highest high in the lead-in phase to the lead-in trend line. These distances can be measured by drawing a vertical line from the highest highs to the lead-in trend line. An example is provided below.
-
Bump Rollover: After speculation dies down, prices begin to peak and a top forms. Sometimes, a small double top or a series of descending peaks forms. Prices begin to decline towards the lead-in trend line, and the right side of the bump forms.
-
Volume: As the stock advances during the lead-in phase, volume is usually average and sometimes low. When the speculative advance begins to form the left side of the bump, volume expands as the advance accelerates.
-
Run Phase: The run phase begins when the pattern breaks support from the lead-in trend line. Prices will sometimes hesitate or bounce off the trend line before breaking through. Once the break occurs, the run phase takes over, and the decline continues.
-
Support Turns Resistance: After the trend line is broken, there is sometimes a retracement that tests the newfound resistance level. Potential support-turned-levels can also be identified from the reaction lows within the bump.
The Bump and Run Reversal pattern can be applied to daily, weekly or monthly charts. As stated above, the pattern is designed to identify speculative advances that are unsustainable for a long period. Because prices rise very fast to form the left side of the bump, the subsequent decline can be just as ferocious.

Level Three Communications (LVLT) formed a Bump and Run Reversal pattern after prices advanced in a speculative frenzy at the beginning of 2000. Prices advanced from 72 to 132 in 2 months and this advance ultimately proved unsustainable.
- The lead-in phase formed over a 3 month period from early Oct-99 to early Jan-00. Volume during this phase was relatively subdued, and actually declined during the November and December advance.
- The trend line extending up from the lead-in phase lows formed a 34 degree angle. A visual assessment also reveals that this trend line is neither too steep nor too flat.
- The bump phase began in early January when the advance accelerated with a large increase in volume. A conservatively drawn trend line formed a 51 degree angle that was exactly 50% larger than the angle from the lead-in trend line.
- The distance from the lead-in phase's highest high to the trend line was 13. The distance from the bump phase's highest high to the trend line was 38. This is almost three times larger, and validates the speculative excesses in the bump.
- After reaching a high around 132, prices declined sharply, and bounced off the lead-in trend line. A lower high formed around 115 (red arrow), and the trend line was soon broken.
- The decline continued after the trend line break, and reached 67 before a reaction rally began. The reaction rally advanced to around 95, but fell just short of the horizontal support line before falling back to new l
Strategy - B:
Pin Bar Trend Reversal Strategy:
The following strategy is a very promising one, but has not been tested over long periods or many different currency pairs. Nevertheless, we thought it might be of interest to Forex traders and since it closely resembles that of the Hammer and Shooting Star candlestick patterns we decide to share it with you. We plan to actually automate this strategy to test it thoroughly over a period of time and on different currency pairs. We will report back on our results when completed. If there is a MQL4 programmer that wants to have a go at this, we only ask that you share your results and hopefuly also the code with all of us.
We discovered quite recently that an Australian by the name of Nial Fuller is actually teaching a similar strategy that he calls "Forex Pin Bar Method" - so maybe there is something about this approach that have merit! Nial had this to say about this strategy: "Trading Pin Bars in Forex with Support and Resistance Confirmation, is perhaps one of the most effective ways to trade, if not the most effective way to trade."
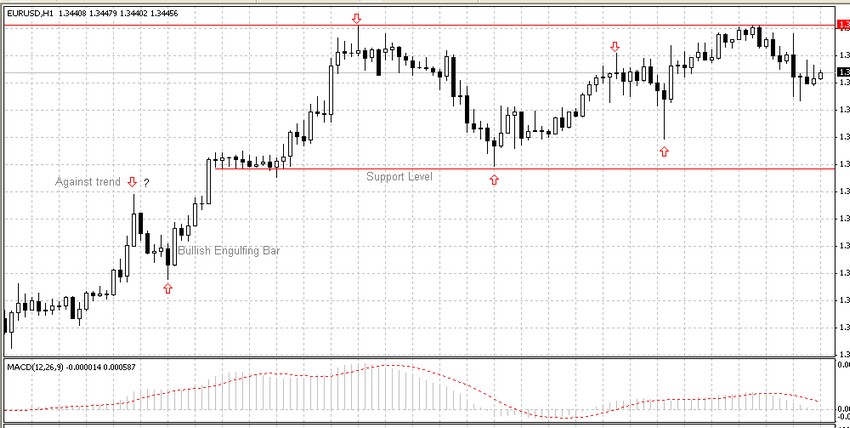
Have a look at the following chart: The MACD indicator plays no role in this example. This is based on pure price action)

The five arrows mark five distinctive bars with long tails. As can be seen from the chart these bars indicate a reversal of price direction.
For this strategy to work with great accuracy there are a number of rules that must be adhered to, e.g.
- The size of the tail in comparison with the body must be as large as possible. The larger the ratio of the tail in comparison with the open - close area/body of the bar in question the better - in other words the smaller the body part and the longer the tail part the better.
- The body part of the bar must be near/at the end of the bar - not in the middle.
- In a bullish price pattern the tail must be at the head of the bar to signal a reversal, and vice versa.
- If the tail is at the head of the bar the next bar must close lower than its open price (be a bearish bar) - and when the tail is at the bottom of the bar the next bar must close higher than its open price (be a bullish bar).
- The high/low of the next bar must not be more than 75% of the tail of the specific (signal) bar.
- The above two rules can be overuled if the tail of the bar is exceptionally long and the full bar part is only a very small part of the total bar. To know when this applies comes only with experience. (A very long or short length of the second bar can also change these rules.)
- When the tail of the bar is short a combination of two long-tailed bars with shorter tails next to each other will also suffice. (Still to be further tested)
- A long tailed bar that just continues the existing price direction is ignored, e.g. long tail at the head of the bar in a downtrend.
- The period must not be too short - the best results will be experienced with the 1 Hour, 4 Hour and Daily charts.
- If there are other confirming signals , e.g. support and resistance levels, candlestick patterns, etc., it will improve the quality of the signal.
- It will most probably be better to ignore signals against a strong trend, except if you want to take a quick smaller profit.
- The buy/sell transaction is opened at the open price of the second bar after the long tailed (signal) bar.
- A stoploss can be placed 2 -3 pips below / above the low / high of the tail.
- Profit take can take place either at the change of the signal, the weakening/fading of the move (constant management necessary), or fixed number of pips.
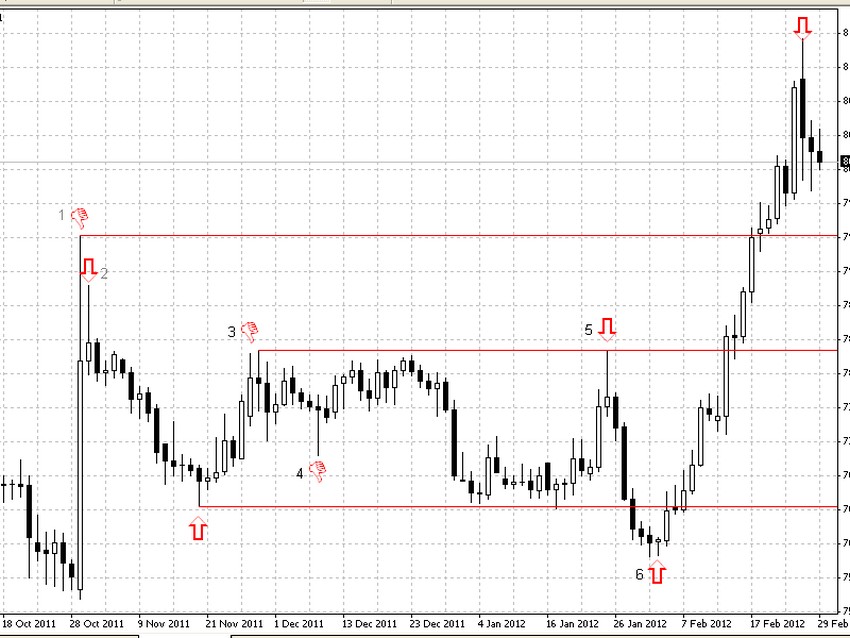
Have a look at the following chart to see from the notes which are valid signals of a reversal of price:

1. The first long tailed bar (no.1) is an unusual and tricky one. It can either be seen as signalling a continuation of the price direction because it is part of a downtrending price movement and its tail is at the head - no att the bottom, but because it is extraordinary long it also creates a new bullish price direction. Therefore the next long tailed bar (no.2) is actually signalling a reversal of price direction from bullish to bearish.
2. The next long tailed bar has a shorter than normally required tail, and would normally be treated with caution, but in this case it accurately forecasts a reversal of price direction.
3. The long tailed bar no.3 does not qualify as a signal bar, because the high of the next bar is more than 75% of the tail of the long tailed bar.
4. The long tailed bar numbered no.4 also do not qualify, because the next bar is a bearish bar and should be a bullish bar to signal reversal of price direction.
5. Long tailed bar no.5 is a perfect example of a reversal signal bar. It complies to all the rules.
6. At no.6 we have two short tailed bars working together to make up for a long tail. The second of the two complies to all the rules except for the length of the tail.
N.B. Be warned that the above is not investment or trading advice, but just a strategy that we are investigating for its usefulness. There is still a lot of work to be done to refine this strategy and confirm that it actually works. Also see Disclaimer.
Strategy - C:
Price Action Strategy:
To successfully trade Price Action a trader must be able to identify if a market is trending or ranging. Once this has been assessed clear levels for support or resistance must be marked for possible setups to trade either long or short.
Identifying the Trend
Technical traders use can use many different tools to identify the trend such as moving averages, however the best tool the trader has at their disposal is their eyes. After much experience and chart time a trader begins to get a feel for how a market is unfolding and moving.
When learning to identify trends it is always best to start on the larger time frames such as the daily charts. These larger time frames hold the key to all the big moves in the market. The chart below shows the daily chart of the EURUSD which is in a very obvious down trend.
Trading with the trend in your favour is always the best course of action. Often you will hear that “the trend is your friend” and this is very true. The reason for this is that the overall trend normally continues until some sort of major support or resistance in the market is hit, or a large fundamental change in one of the economies involved occurs.
A pattern in the market that may signal a trend is under way is known as the “1,2,3 pattern”. This pattern is made up of 3 legs of price movement. For a bearish trend the pattern is made up of;
1. Price falls lower
2. Price retraces and creates lower high
3. Price falls lower again and creates a new lower low
In the chart below we have an example of this pattern. We can see that price first went lower before then retracing and creating a lower high. The pattern was then confirmed when price went lower and created a lower low.
Marking Support and Resistance
Support and resistance is a very important part of the Forex market. Price will often bounce or move away from support or resistance so learning how to mark these levels correctly is critical.
To mark support and resistance we need to mark the most obvious levels on the larger time frames charts such as the 1 day chart. The levels we plot on the daily chart will guide us when trading on the intraday charts such as the 4hr and 1hr.
Below is a chart of the daily EURAUD. Only the very clear and obvious levels have been marked. Take note just how closely price respects these areas.
Waiting For Price to Reach Key Levels
Once support and resistance levels have been marked clearly on a chart, the next job of a Price Action trader is to watch and wait for price to reach these important levels in the market. Price Action gives clues all the time as to what direction it is looking to trade in.
Traders should pay particular attention to what price does when it reaches the support and resistance levels and whether price rejects these levels or breaks out. Traders all over the world are watching these levels and watching for trading opportunities.
The following chart shows an example of an area that traders would be watching and waiting for price to reach.
Matching Price Action Setups with Support and Resistance
Once traders have worked out the strength and direction of the trend and also identified the key places in the market they would like to enter, they then need to learn to trade Price Action signals from these key areas.
Examples of powerful Price Action signals are;
The Pin Bar Reversal
The Engulfing Bar
The 2 Bar Reversal
Traders can learn the ins and outs of how to trade Price Action signals through a course such as our Forex Trading Master Course.
To successfully trade Price Action setups traders will need to learn everything about the setups, including how to enter, how place stops and how to correctly manage trades once they are in them.
Putting it All Together
Trading with as many factors in your favour is going to increase the chance of placing a winning trade. Smart traders try to trade with as much confluence as they possibly can. When looking to trade Price Action signals try to trade with;
The trend in your favour
From key levels in the market
Reliable and proven Price Action signals
Trading Price Action does not need to be a made complicated. The traders that usually turn out to be the successful Price Action traders always look to trade with as many market factors in their favour as they can.
Source: http://www.dailyforex.com/forex-articles/2012/02/Learning-to-Trade-Price-Action-/10951
E-mail: [email protected]


